Introduction
How to install t4gpd
Please visit this web page.
Is there a Dockerized version of t4gpd?
Yes, you can find more information here.
What is the installed version number of t4gpd?
import t4gpd

print(t4gpd.__version__)
Where can I find the sources of t4gpd?
The official sources of the t4gpd project are available on this page.
How to load pre-recorded demos datasets
This section aims to present several static methods of the t4gpd.demos.GeoDataFrameDemos class. More precisely, it is about presenting the following methods:
GeoDataFrameDemos.singleBuildingInNantes()
GeoDataFrameDemos.districtRoyaleInNantesBuildings()
GeoDataFrameDemos.districtRoyaleInNantesRoads()
GeoDataFrameDemos.districtRoyaleInNantesPaths()
Note : As you can see, these methods expect no arguments.
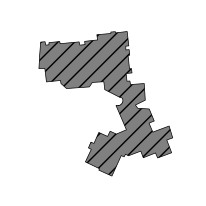
Loading a single building footprint
In the following code snippet, buildings is a classical GeoPandas GeoDataFrame. You could replace this instruction by loading a shp file from your hard disk using the geopandas.read_file(...) method.
from t4gpd.demos.GeoDataFrameDemos import GeoDataFrameDemos

building = GeoDataFrameDemos.singleBuildingInNantes()
To map it via matplotlib, proceed as follows:
import matplotlib.pyplot as plt

_, basemap = plt.subplots(figsize=(0.25*8.26, 0.25*8.26))
building.plot(ax=basemap, color='grey', edgecolor='black', hatch='//', linewidth=0.5)
plt.axis('off')
plt.savefig('img/demo1.png')
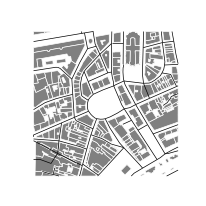
Loading a set of buildings and roads
To load a pre-recorded dataset of 248 building footprints and more than 3.6 km of roads1, proceed as follows:
from t4gpd.demos.GeoDataFrameDemos import GeoDataFrameDemos

buildings = GeoDataFrameDemos.districtRoyaleInNantesBuildings()
roads = GeoDataFrameDemos.districtRoyaleInNantesRoads()
To map it via matplotlib, proceed as follows:
import matplotlib.pyplot as plt

_, basemap = plt.subplots(figsize=(0.25*8.26, 0.25*8.26))
buildings.plot(ax=basemap, color='grey', edgecolor='white', linewidth=0.5)
roads.plot(ax=basemap, color='black', linewidth=0.5)
plt.axis('off')
plt.savefig('img/demo2.png')
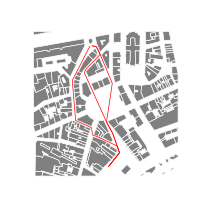
Loading a set of pedestrian routes
To load a pre-recorded dataset of 3 pedestrian routes, proceed as follows:
from t4gpd.demos.GeoDataFrameDemos import GeoDataFrameDemos

pathways = GeoDataFrameDemos.districtRoyaleInNantesPaths()
To map it via matplotlib, proceed as follows:
import matplotlib.pyplot as plt

_, basemap = plt.subplots(figsize=(0.25*8.26, 0.25*8.26))
buildings.plot(ax=basemap, color='grey', edgecolor='white', linewidth=0.5)
pathways.plot(ax=basemap, color='red', linewidth=0.5)
plt.axis('off')
plt.savefig('img/demo3.png')
Note: This mapping presupposes that you have already loaded the building footprints.
t4gpd embeds two distinct types of geoprocessing
Geoprocesses derived from AbstractGeoprocess
The first category of geoprocesses derives from the AbstractGeoprocess class. The specificity of these geoprocesses is that they cannot be invoked directly but through the STGeoProcess class.
STGeoProcess(geoprocessToApply, gdf)
This is for example the case of the BBox class (BBox stands for bounding box), which must be explicitly invoked as in the following code snippet:
from t4gpd.demos.GeoDataFrameDemos import GeoDataFrameDemos
from t4gpd.morph.geoProcesses.BBox import BBox
from t4gpd.morph.geoProcesses.STGeoProcess import STGeoProcess

building = GeoDataFrameDemos.singleBuildingInNantes()
bbox = STGeoProcess(BBox(), building).run()
The following classes are in the same category (non-exhaustive list): AngularAbscissa, AreaConvexityDefect, AspectRatio, BBox, BiggestInscribedDisc, CanyonStreetOrientation, CircularityIndices, ConvexHull, ConvexityIndices, Diameter, EllipticityIndices, FootprintExtruder, GridFace, HeightOfRoughness, HMean, IdentifyTheClosestPolyline, MABE, MABR2, MABR, MBC, MPBR, RectangularityIndices, RemoveHoles, Rotation2D, SkyMap2D, SkyViewFactorOnTopOfRoof, SkyViewFactor, StarShapedIndices, SurfaceFraction, Translation, WMean.
Geoprocesses derived from GeoProcess
This second category gathers the largest number of geoprocessing operations. As direct subclasses of the GeoProcess class, these geoprocesses offer two distinct methods: run() and execute(). The second one returns, in addition to the result of the first one, a measure of the calculation time.
-
These building and road geometries are derived from the IGN's BD Topo. ↩